I spent my career building “things” and then finding ways to monitor that they were working. Early on, this included having a human go to websites, take screenshots, and save them. This made no one happy.
Then one day, sat in the office helping QA a website before it went live, it came up in conversation that the product and QA team already tested everything I wanted to test with bots, and yes, they could save me some screenshots in a folder when they did it. How frequently did I want them?
So when I recently started exploring infrastructure, monitoring was one of the areas that interested me most. I did my research: Grafana and Prometheus was the stack used in industry, so that seemed like the one. A few guides later, some pestering of Gemini and Claude, and I had my first runbook to set up my own monitoring stack.
The goal was to monitor the Docker containers on my home server, a Proxmox box with an Ubuntu VM, containers organised with Portainer.
I added Grafana, Prometheus, and cAdvisor following the multitude of guides, and hit a wall. Nothing was working. A few searches led nowhere, the logs didn’t show anything wrong, it just didn’t work. I turned to AI agents and started working through a multitude of excited suggestions which would immediately fix this. None did.
Eventually we had success! cAdvisor wasn’t working because of something I didn’t understand at the time, but Telegraf would work just as well. However, this was many hours of YAML editing later.
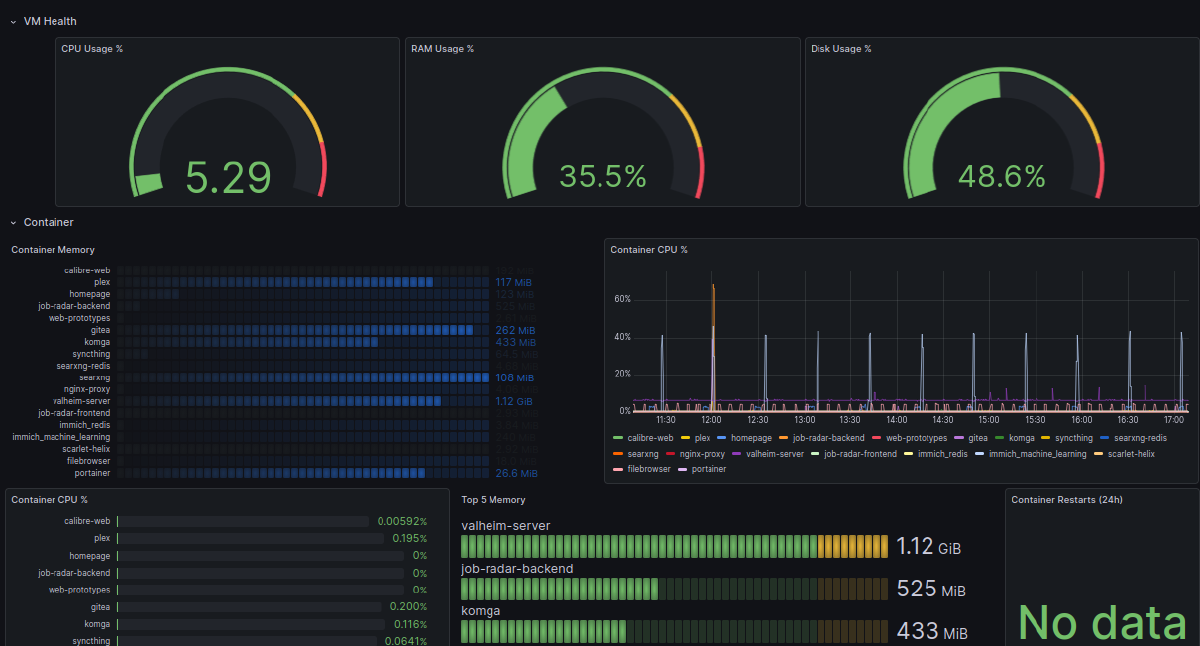
Then it was time to make my Grafana dashboard. All of the guides and advice use particular labels, which are not the ones used by Telegraf. The actual process was frustrating and took forever, every logical step to add the top 5 most resource-intensive containers seemed to lead to 15 rows of identical Valheim mocking me. But in the end I got lucky and was blessed with a lovely and useful dashboard.
I loved this dashboard. I look at it on my phone and laptops using Tailscale to check if things are working when they should be (frustratingly, they often won’t). I’ve seen when my partner was watching something on Plex, that my 6-hourly scheduled actions were happening with the tools I’d built, and that I was running a bunch of containers I wasn’t using which took 30 seconds to start, so I turned them off to save resources.
Then I saw a new Manchester tech meetup: Grafana and Friends. I’d just seen someone explain some interesting ways of using OpenTelemetry, a topic which would be coming up again. I did some research considering whether I could launch something before the meet, and while I didn’t end up using OpenTelemetry, I did manage to add Prometheus scraping to two of my Tailscale nodes. Maybe more excitingly, I discovered you can download other people’s incredibly beautiful and professional dashboards.
When it was set up (original estimate 30 mins, total time around 2 hours) I downloaded a couple of other dashboards. I couldn’t, however, find one to display my Telegraf-sourced Docker monitoring. I ended up having Claude Code build me a fresh dashboard, and in the process I finally worked out why the original issue had happened.
cAdvisor does not like cgroup v2, and as I’d set up my home server in 2026 with an Ubuntu VM, it automatically had cgroup v2. The update had changed the file structure, which led to hours of personal frustration that could have been diagnosed in minutes if I’d known where to look.
Also, this is my first homelab. It’s an old PC turned into a home server with a 4TB HDD added. This setup gave me a bunch of storage, but it led to a non-traditional Docker configuration (also the first time I’d ever set up Docker and/or Portainer). This would also have prevented cAdvisor from working.
I did some searching. There are over 25,000 Grafana dashboards, but none of them seem to cover my situation, which feels like a situation that’s going to come up a lot for people building a homelab. So I added my dashboard to the Grafana community library with an explanation of what it covers. You can find it at https://grafana.com/grafana/dashboards/25012-pickles-container-overview-v2-telegraf.
That’s how my first contribution happened. You can tell it’s mine because of the logo.