Friday afternoon I was on the train and I was talking to a Senior SRE on Discord, the conversation covered the different variety of roles and job titles, such as DevSecOps. I did a little research on some of these and it inspired me to search Grafana cloud for Loki Logs and how to make a dashboard, luckily I had inputs from the Alloy agent I had set up earlier than week so a dashboard was created for me in realtime, the inbuilt AI streaming its build process and it appeared part by part on my phones screen.
The Alloy agent had been running since earlier in the week when I had first installed Grafana alloy onto my home and German cloud servers to test a new option to easily add monitoring to cloud servers to show Geeks for Social Change (GFSC). I had managed to add working dashboards showing both servers individually and separately in about an hour, its magic. Setting up a Logs/Loki dashboard was just as easy this time, however I was struggling to add discord webhooks for the alerts so I left it..
Saturday: Adding the alerts#
Saturday evening, I finished cleaning up the house a bit and sat down to add the alert rules with the discord webhook alerts:
- CPU and Disk usage
- Restart detection
- Interface status and Error rates
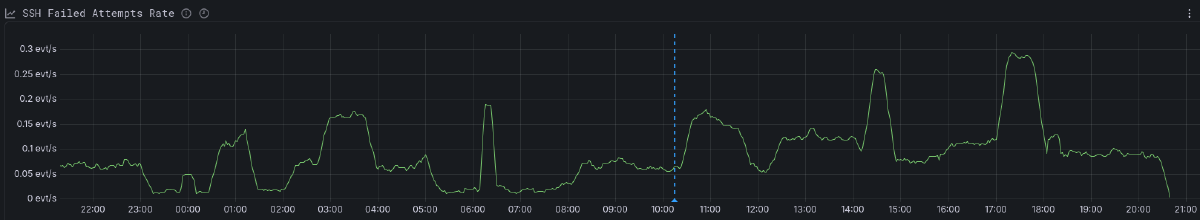
- SSH Auth Failures
- UFW blocks
I hooked them to the Discord webhook, tested each one and they sent alerts to the channel and it pinged. Some didnt work immediately and needed a bit of fine tuning, so at the end I asked the useful AI to check them and it said, all working, ones alertings, brute force attack in progress and starting bringing up stats, charts, IP addresses of the attackers, everything just like a 80s hackers film.
Next steps#
I looked at the data, realised what was happening, opened claude code, used my knowledge of LLMs and domain knowledge focussing language and typed “We are under attack…” and added in the relevant logs from Grafana.
Claude Code (Sonnet 4.6 - yes Opus 4.7 was live and I had a full usage free, but how long would this take? Better to manage resources at first) has access to my obsidian vault and SSH access through tailscale to my server. In 2/3 prompts and responses it had given me a plan to check the situation, confirmed it, suggested 3 steps to fix and advised on which to do, then took action I approved. When this was completed and I confirmed manually I had it document what had happened whilst it was all in context, write its own post mortem which I started additional alerts in case any of the attacks were successful.
What the dashboard showed#
The scale was difficult to frame initially, roughly 7,500 failed SSH auth attempts in the last 24 hours, all against my public-facing VPS. My private server was completely untouched.
The baseline was about 0.05–0.06 events/sec — the “ambient noise” of the internet. But in the previous 11 hours, the rate had doubled, peaking at 0.28 events/sec. This pattern was later described as initial mapping Friday followed by actual attempts to brute force on Saturday.
The usernames were also came up in the initial grafana ai response:
rootdominated (around 3,900 attempts)admin,ubuntu,user,test,debian,git,postgres,node,deploy
The most persistent IP had hit the box 1,270 times by itself but there was a list available of every IP that had made an attempt. The logs had been sitting in Loki the entire time, and showed in the dashboard, however as I hadn’t set up the alerts and I hadn’t been reading and filtering the logs I had no idea, which probably was for the best it would have ruined my Friday night out.
The good news: All the successful log in attempts were from a single IP address, which was mine and tailscale. So whilst there were gaps, and eventually this had a legitimate change of breaking through eventually, it hadn’t.
The response#
One of the first things Claude did was check if PassWordAuthentication was set to yes. To check the effective SSH config it used sshd -T.
Note: If you aren’t using
sshd -T, start. It dumps the actual runtime state of the daemon, regardless of what you think you wrote in your config files.
sshd -T showed that PasswordAuthentication was set to yes.
This wasn’t what was meant to be set up. A review of /etc/ssh/sshd_config.d/ found two files which had caused this:
50-cloud-init.conf→PasswordAuthentication yes60-cloudimg-settings.conf→PasswordAuthentication no
Because sshd loads these alphabetically and applies first-match-wins semantics, the 50- file from the initial provisioning was silently overriding my hardening file. This is what the bots had probably been looking for when scanning through the internet and when it got a positive on the Friday, led to the attack on the Saturday.
Closing the gap#
The changes which were recommended and approved were:
Fixed the override. Set
PasswordAuthentication noin the cloud-init file (the one that was overriding). Validated withsshd -tand ransystemctl reload sshto keep the live session up.Locked the door. Bound
sshdto the Tailscale interface plus loopback only:# /etc/ssh/sshd_config.d/99-tailscale.conf ListenAddress <your-tailnet-ip> ListenAddress 127.0.0.1Public port 22 no longer answers.
last -n 10confirmed every successful login I’d had for weeks came over the VPN anyway, so it was a low risk of losing access.Sent in the guards. Installed
fail2ban. It had been meant to be working, however on closer review it wasn’t fully installed/configured.
I verified a fresh connection over Tailscale worked before closing the session, but worst case I have click ops access and could just wipe the server and start again.
Four more alerts#
As Claude was writing up the documentation in highly detailed (annotated with learning notes) and blog friendly public release details, I added four more alerting rules. These were to check different actions a successful attacker might take:
- A successful root login from an unexpected source.
- New entries in
sudoers. - New SSH keys appearing in
authorized_keys. - Unusual process activity.
Two things worth taking away#
sshd -T is the only source of truth. Reading individual config files tells you what should be true. sshd -T tells you what is true. The files and the config should have worked, but it’s best to check that it works.
Logs without alerts are an archive, not a monitor. I had the logs active for a week, the dashboard for over 24 hours, and the alerts active for minutes when I realised what was happening.
Edit - Sunday - The additional alerts I added pinged a few times because I set them up to alert with no data, so whilst things were safe I did worry slightly when I checked discord, 15 mins with the Grafana AI this morning and 1 simple edit to each and now the alerts correctly set to normal